


Ticketing Analytics Platform
How ZAPTA built a real-time analytics and ticketing-insights platform that reveals pricing trends and optimal purchase timing, helping buyers across 100+ locations purchase 15K+ tickets and save over $100K.


Have an idea, a product, or a problem worth solving?
Book a free 30-minute discovery call with a senior product engineer and walk away with a clear roadmap.
Start a Conversation
Project snapshot
Engagement at a Glance
PeakSeats was built to serve buyers, sellers, and market analysts with actionable intelligence around live-event ticket pricing and availability. Rather than simply listing tickets, the platform focuses on uncovering market dynamics, so users can make smarter decisions about when to buy or sell.
Event ticket markets are complex and volatile, with prices driven by supply, demand, timing, and hidden fees. Buyers often lack visibility into pricing trends and the best windows to purchase, leading to missed opportunities or overpaying, while sellers struggle to judge the right time and price to list. Existing tools offered listings but little genuine market intelligence.
ZAPTA designed and delivered a full-stack web platform that aggregates ticket-market data, analyzes trends, visualizes insights, and provides clear guidance for both buyers and sellers, built on a scalable architecture able to ingest high volumes of market data in real time.
100% properties
Event locations covered
15K+ Tenants
Tickets purchased through insights
$100K+ Active
Saved for buyers
The challenge
What the project set out to solve
Ticket markets are opaque and volatile, five challenges shaped the brief for a real-time analytics platform.

Unpredictable pricing
Volatility
Ticket prices shift constantly with supply, demand, timing, and hidden fees, making it hard for anyone to know what a fair price really is.

No visibility into timing
Buyers
Buyers lacked insight into pricing trends and the best windows to purchase, leading to missed opportunities or overpaying.

Guesswork on listing
Sellers
Sellers struggled to judge the ideal time and price to list tickets, leaving value on the table.
The solution
A real-time market intelligence platform
Four design decisions turned an opaque ticket market into clear, actionable guidance for both sides.
Real-time aggregation
Data Engine
A data-aggregation engine gathers ticket listings, pricing histories, inventory changes, and supply-demand signals in real time across 100+ locations.
Trend dashboard
Visualization
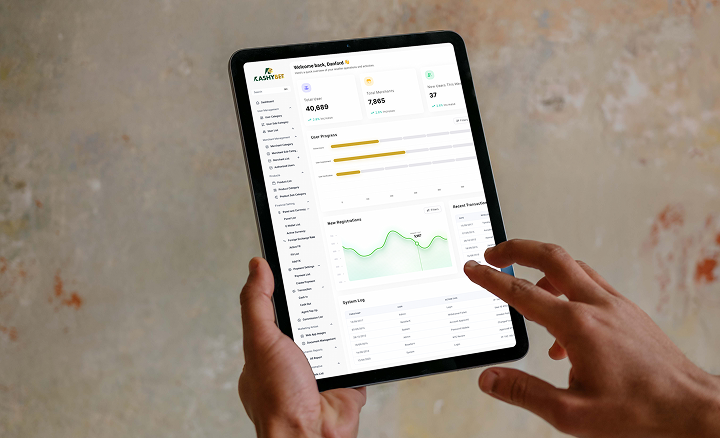
Interactive charts reveal pricing movement, supply drops, and the optimal windows to act turning raw data into clear visual insight.
Tailored modules
For Buyer & seller
Dedicated interfaces give buyers a “best time to buy” view and sellers a “best time to list” view, each built around their decision.
Alerts & recommendations
Audit friction
Automated triggers fire when prices move sharply or supply tightens, helping users act at the right moment rather than after it.




What Terry Said


Meticulous attention to detail and unwavering commitment to deadlines fuelled a fantastic project collaboration. Their consistent quality output showcases their reliability and deep understanding of the project, making them a true partner, not just a vendor. Bravo, ZAPTA!


Key features build
What we built
A complete, full-stack analytics platform, each capability built to turn volatile ticket-market data into confident decisions.
Gathers large volumes of listings, pricing histories, and supply-demand signals in real time, forming the backbone of the platform’s intelligence.
Interactive charts and graphs surface pricing movement, supply drops, and optimal purchase windows at a glance
A “best time to buy” view helps buyers avoid overpaying and act when prices are most favorable.
A “best time to list” view helps sellers price and time their listings to capture more value.
Automated triggers notify users of sharp price moves or tightening supply, enabling proactive decisions.
A modular architecture built for high-volume data intake and fast UI response, ready for future expansion.
Results delivered
The outcomes that mattered
Value delivered across coverage, savings, and decision-making, anchored by real platform usage.
100+
locations
Event locations covered by real-time market data.
15K+
purchased
Tickets purchased by users acting on platform insights.
$100K+
saved
Total savings buyers achieved by buying at the right time.
Real-time
types
Automated workflows replaced manual market monitoring.
Transparent
Requestes
Buyers and sellers gained insight into an otherwise opaque market.
Scalable
Centerlized
A base ready for predictive pricing and marketplace extensions.
Stack
The technology stack
A secure, cloud-ready web stack selected for real-time reporting, AI-powered legislative monitoring, and audit traceability. (Representative stack.)

React

Node.js

PostgreSQL

AWS

Redis

Stripe

Docker

REST APIs
Our three-phase delivery process
Real scenarios where founders, operators, and enterprise teams brought us in to build software that shipped to production:
Consult and align

- Discovery workshop to align goals, users, workflows, and outcomes.
- Requirement gathering and stakeholder interviews business, and compliance.
- Technology selection based on scale, performance, security, and long-term maintainability.

Discovery, strategy, planning, requirement gathering, roadmap alignment.
Design and engineer
- High-fidelity UX in Figma web, mobile, dashboard, and admin interfaces.
- System architecture covering data models, APIs, integrations, auth, and compliance.
- Agile sprints with weekly working demos and live client feedback loops.

UI/UX, architecture, development, testing, iteration.
Deploy and maintain
- Deployment to AWS, GCP, or Vercel with CI/CD pipelines and zero-downtime releases.
- Observability with Datadog, Sentry, or Grafana live from day one tracing, errors, and performance.
- Security hardening, access controls, and compliance-ready audit logging.

Launch, monitoring, support, optimization, scaling.
Want this process for your software project?
Tell us about your project and get a tailored development roadmap within 24 hours.
Start your projectReal software projects we've shipped
Real scenarios where founders, operators, and enterprise teams brought us in to build software that shipped to production:


Enterprise legacy modernization
Rebuilt a Fortune 500 team's internal operations system migrated from legacy stack to cloud-native in 16 weeks with zero downtime during cutover.


Property Management Platform
How ZAPTA helped a property-management company replace fragmented manual operations with a single platform connecting tenants, vendors, and property owners, with 20,000+ properties listed across 10 US states.

Digital Identity Verification App
How ZAPTA delivered a secure digital-identity and contact-management mobile app that keeps users’ details verified and up to date in real time, launched across Denmark and the USA with 5,000+ verified users

Unified GRC Platform
How ZAPTA helped deliver a unified governance, risk, and compliance platform that automates compliance, risk, and legislative tracking — cutting regulatory-change monitoring time by 40% and audit preparation by 35%.

Smart POS Platform
How ZAPTA helped a technology company build a SaaS point-of-sale platform that unifies sales, inventory, and payments with real-time analytics and full online–offline functionality — built for the Saudi market across four sectors.

Healthcare Onboarding Platform
How ZAPTA helped a healthcare organization replace a manual, fragmented hiring process with a unified, compliance-ready onboarding platform, bringing applicants, employees, referees, and administrators into a single role-based system.

FinTech Trade & Financing Platform
Founder with a clear vision shipped a multi-tenant SaaS platform in 12 weeks auth, billing, dashboards, and core workflows. Live customers within 90 days.

Content Platform Redesign
How ZAPTA helped redesign and rebuild the V3 experience for a leading content-repurposing platform, bringing clarity, consistency, and a unified design system across every module of a product trusted by 980K+ creators.

AI EdTech Platform
How ZAPTA helped an EdTech client turn traditional tutoring into a personalized, AI-driven experience, intelligently matching students with suitable tutors, with 1,500 students enrolled and 591+ expert tutors on the platform.

B2B SaaS platform from zero
Founder with a clear vision shipped a multi-tenant SaaS platform in 12 weeks auth, billing, dashboards, and core workflows. Live customers within 90 days.
Real Estate Fintech
How ZAPTA delivered a secure digital-identity and contact-management mobile app that keeps users’ details verified and up to date in real time, launched across Denmark and the USA with 5,000+ verified users
Love the simplicity of the service and the prompt customer support. We can’t imagine working without it. Love the simplicity of the service and the prompt customer support. We can’t imagine working without it.

Awards & recognitions


Love the simplicity of the service and the prompt customer support. We can’t imagine working without it. Love the simplicity of the service and the prompt customer support. We can’t imagine working without it.

Our partners


Love the simplicity of the service and the prompt customer support. We can’t imagine working without it. Love the simplicity of the service and the prompt customer support. We can’t imagine working without it.

Our clients